|
|
KB 017
|
Category: Help
Title: Tracking
 Summary: The chapter in "Make It Happen!" that discusses the seventh step in creating a goal: Tracking
|
|
Product: GoalTrak™ EV, GoalTrak™ CV, GoalTrak™ PV
|
Version: All
|
Description:
|
GoalTrak EV - Tracking Progress
Other goal setting procedures stop at this point, but we want you to have the best chance at achieving your goals which includes the next three Steps. The Technology/Art of Goal Setting goes beyond the effort you have just made. The principle of "feedback" is critical when you implement a goal. You need to know how you are doing. You need a scoreboard, or tracking system to help guide you along your path. By tracking your own progress you will be able to make adjustments sooner, rather than later, when you find yourself off-track or behind schedule.
In this step you will capture the criteria to measure your progress toward achievement. If your goal statement has been correctly written, there will already be several measures included as elements. Extract at least two of these and enter them in this field. Whether they are numbers of units, people, meetings, days, months, or dollars, it does not matter.
Continuing with our sales goal example, the number of inside sales people hired monthly, monthly revenue increase from existing accounts, and quarterly closing ratios make excellent tracking measures. You need to have at least two, if not more, interim ways of tracking your goal, to know how you are doing between now and the target date for the achievement of your goal. (GoalTrak EV will not let you go beyond this point if you have less than two measurable criteria). In many cases, this will be months, perhaps years, depending on the complexity and magnitude of the goal. Identifying these measurable criteria will permit you and anyone else involved in this process to know exactly where you are at any given time in your quest.
If you aren't convinced of the effectiveness of tracking then consider a sporting event, any event, being held without a scoreboard! Imagine what a basketball game would be like without the scoreboard lit up and running throughout the game. How would the players know when the quarter was about to end? Do they all wear their own watches? How do the fans, the coaches, and the players know who is leading the game? Do they keep a mental tab of the score? Finally, at the end of the game - how do we know it is the end? How do we know who won? WE DON'T!
Not only does this feedback method help us measure each team's progress toward its goal of winning, it also provides motivation to push harder if you are behind, or change the line-up if you are far enough ahead. Sometimes the most exciting moments of the game come near the end. Why? Because the feedback, or tracking system indicates that one side needs to work harder or differently to make its goal. If they want the goal badly enough they'll put out extra effort in an attempt to win. All because of information the scoreboard presented. You can make your own scoreboard with your tracking system. Think of it as your friend, coach, or high priced consultant. You may get mad at it periodically because it will tell you the truth. Sometimes the truth is hard to take, but it's the only thing that can get us back on course! Embrace it!
GRAPHING
Graphing the information you glean from your tracking system paints a picture of your progress, and you know the expression, "a picture is worth a thousand words". This paraphrase of an old proverb has not been truer than in the Technology/Art of Goal Setting.
Results are the outcomes of Goal Setting. Graphing those results constructs the scoreboard we just described. Why do this? The easier it is to track and review results, the more likely it is that you will pay attention to what you are doing. If you pay attention, then there is a better chance that you will respond appropriately to what needs to happen on your way toward your goal.
One of the basic tenets of goal setting is that the goal must be measurable. There must be some tangible way to know how you're doing. As events occur, quantities of time, people, dollars, customers, parts, sales, etc., accumulate as measurable results. Most often, these measures are the last line of a computer report from finance or sales, or some other department. Raw numbers are difficult to work with. The eye sometimes transposes them; or there are so many numbers we can't separate the wheat from the chaff.
Graphs, however, convey a clear message. The bar, line, pie slice or dot position is easily compared to another of the same design. It is higher or lower, bigger or smaller, shorter or longer; not dependent on the brain's processing power; only on our vision. Fast conclusions may be drawn and decisions made in a timely manner. More information can be accessed if necessary. In fact, you can think of it as a form of feedback shorthand. Show anyone, an employee, a cohort, your son, or your 91 year old mother-in-law, a bar graph, in fact use the sample that follows. Ask, "Which sold the most? We bet all of those people could tell you the right answer! (No fancy tricks now, like inverting the numbers on the graph!). It is immediately evident that Products outsold Services and Contracts both, by a large margin. That is the power of the picture.
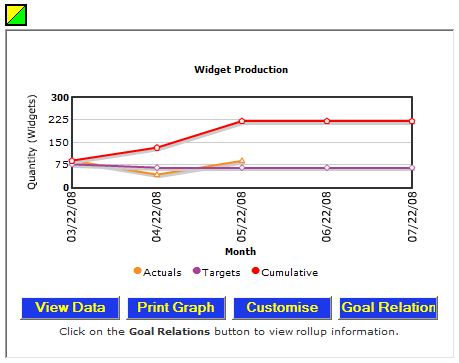
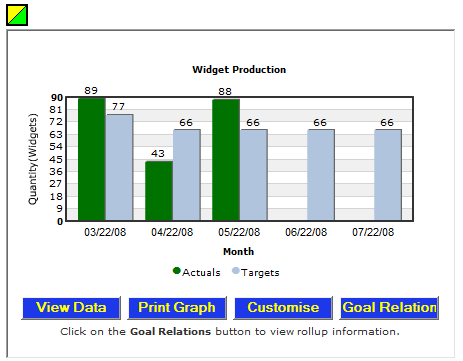
Our current computer and software capabilities make the use of graphs so easy that almost anyone can be proficient at presenting data. Graphs do not have to be fancy and complex. They do not have to be in color to be effective. Often, the simpler the graph the better it communicates its message to you. Graphing the results of your progress toward achievement is an effective communication tool to keep everyone involved up to date without lengthy meetings, phone calls, memos and reports. The following samples show how various data may be effectively presented using the line and bar chart styles.
Links to the chapters for each of the nine steps are listed in Related Topics below.
|
Related Topics:
|
|
Author: Richard Lewine
|
|
Published: January 15, 2006
|
|
Revised:
|
Copyright© 1993-2010 Achievement Alliance Corporation
Copyright© 2007-2010 Quantum Voyage |
|
Quantum Voyage
2571 Whiteway Court
Aurora, IL 60504
Phone: 630-236-5332 Steve
Phone: 215-997-5954 Rich
|
Loading |

 Summary: The chapter in "Make It Happen!" that discusses the seventh step in creating a goal: Tracking
